 ExcelToKml can draw direction arrows on a GPS track. The column headings to look at are "IconHeading" and "IconColor".
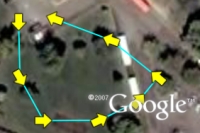
The picture to the right shows an example of a GPS track. Note that the arrows point in the direction of travel. This track was plotted with the following spreadsheet values:
| A | B | C | D | E | F | |
| 1 | Latitude | Longitude | Icon | IconHeading | IconColor | LineColor |
| 2 | 43.6097 | -116.2048 | 196 | line -180 | yellow | aqua |
| 3 | 43.6095 | -116.2047 | 196 | line -180 | yellow | aqua |
| 4 | 43.6094 | -116.2046 | 196 | line -180 | yellow | aqua |
| 5 | 43.6094 | -116.2044 | 196 | line -180 | yellow | aqua |
| 6 | 43.6094 | -116.2042 | 196 | line -180 | yellow | aqua |
| 7 | 43.6095 | -116.2041 | 196 | line -180 | yellow | aqua |
| 8 | 43.6096 | -116.2043 | 196 | line -180 | yellow | aqua |
| 9 | 43.6097 | -116.2046 | 196 | line -180 | yellow | aqua |
This spreadsheet is included in the sample data.
The column IconHeading specifies how many degrees to rotate the icon. IconHeading can be a number, the word "line", or the word "line" plus or minus a number.
 For example, Icon 222 is Google's airplane icon. It looks like this on Google Earth.
 If a value of 90 is entered into the IconHeading column, the icon is rotated 90 degrees to the right.
 If a value of -90 is entered into the IconHeading column, the icon is rotated 90 degrees to the left.
If the word "line" is entered into the IconHeading column, the airplane is rotated to point in the direction of travel. That is, the airplane looks like it is flying along the line.
If the value "line-180" is entered into the IconHeading column, the airplane is lined up with the direction of travel, then spun around 180 degrees. The airplane looks like it is flying backwards.
 To fix this, use a value of "line-180" (or "line+180"), which flips the arrow around 180 degrees and points it in the right direction.
 Another problem is that the arrow is hard to see because it is just an outline. Use IconColor to add color to any icon. Yellow looks like this:
This combination of IconHeading and IconColor gives us the GPS track illustrated at the beginning of this article.
26 comments:
Oh, great!
But, it's possible to draw a coloured surface with your utility among the points? Thanks
Bill,
I just wanted to say thanks for the great resource. Your conversion utility and well
documented quick start guide helped me add a travel route for google map/earth
to my blog, http://mikeandtrin.blogspot.com/
Mike
I need to draw 5 unconnected tracks across the globe. Each line is a different color. How can I do this?
If I understand correctly, you want five separate lines drawn on the globe. If you have one interrupted list of lat/lon coordinates, it will be necessary to introduce a break in the data between each track.
Options, ranked from uninteresting to interesting...
1) You can put each track into separate spreadsheets.
2) You can put each track into a separate tab (worksheet) in the same workbook.
3) You can put all of the data into one worksheet, but put a blank line in between each track.
4) You can put all of the data into one worksheet, with no blank lines, but leave the linecolor blank for the last point of each track. That way, ExcelToKml will not connect that point to the next one.
Hope this helps. Please let me know.
Can I draw seprate traks from a central point to all other location ???
They can be drawn as separate lines, all starting at the same point. An example is available at www.earthpoint.us/Downloads/SeparateLinesCommonOrigin.xls
I can not get my Icon so show up in my kml files. I have the correct heading in my .csv files long, lat, Name, Icon.....and use the icon number recommended and nothing.
If you email me your file, I would be happy to look at it.
Hi Bill,
I have a question & it'll be a great help if you could suggest me with the following.
I have a kml file, created by arcmap 9.3, which iam opening in Google Earth for observations. One of the layers in the arcmap has a "bearing" field, which determines the direction of the arrow icon on the map. The google earth only recognizes "Rotation" tag. As of now, every arrow icon points to "eastward" direction. When converting to kml, could you suggest me anything which can modify the KML in the Arcmap, so that i can insert the tag in the kml generated ?
I am not that familiar with the export functionality of ArcGIS
Hi Bill,
Thanks for the product. It works great. My question is if I have an altitude with each point is there a way to post it in 3D space?
Thanks again,
Phil
Do the result from kml file work only on google earth ? coz it's not work in google map , openlayer,... ex: dimension of arrows and arrows color.
Yes, Google Earth only. Google Maps does not support all of the KML features. For example, IconColor and IconHeading are not supported in Maps.
I just wanted to say thanks for the great resource.
I also need one arrow to another arrow distance with center of the Line.
Please Help me.
I want to view a spreadsheet on google earth which is made with UTM coordinates. Is it possible? If yes, then how?
The following links are to a sample spreadsheet and the and the resulting map in Google Earth.
1) UtmCoordinates.xlsx
2) UtmCoordinates.kmz
The map was created with the "Excel To Google Earth" utility www.earthpoint.us/ExcelToKml.aspx
Spreadsheet columns
1) Easting - The UTM easting. This example a common case that has easting and northing in separate columns. Note that the Earth Point utilities actually look for the "Position" column (or Latitude and Longitude columns). The Easting and Northing columns are ignored.
2) Northing - UTM Northing.
3) Position - This is the column Earth Point looks for. In this case an Excel formula creates the UTM coordinate using the other data columns.
4) data1 - random data, used to demonstrate the "AppendDataColumnsToDescription" column.
5) test2 - random data
6) field3 - random data
7) Name - The label that appears next to each icon in Google Earth. In this case, an Excel formula uses the spreadsheet row number as the label.
8) Icon - A number that represents an icon from the table at the bottom of the Excel To Google Earth page
9) HideNameUntilMouseOver - reduces map clutter when many icons are located close together.
10) AppendDataColumnsToDescription - an easy way to show the spreadsheet data when each icon is clicked on Google Earth.
11) AppendLatLonToDescription - adds the latitude/longitude conversion to the data in Google Earth.
Other columns that can be added include IconColor and IconScale. These and others are explained on the "Excel To Google Earth" page www.earthpoint.us/ExcelToKml.aspx
Note - if you just need the conversions and not the map, then the same spreadsheet can be run through the "Batch Convert" utility www.earthpoint.us/BatchConvert.aspx The Batch Convert utility looks for the "Position" column and ignores the others.
cómo colocar en el excel para la leyenda.?
The column heading "Name" is used to place a label next to each icon. The column heading "HideNameUntilMouseOver" is a good way to reduce map clutter when several icons are located close together.
Where can I find the icon to number chart? I want to use a different icon than the arrow or airplane.
The list of icons is at https://www.earthpoint.us/ExcelToKml.aspx#GoogleEarthIcons
These are the official Google Earth icons, made easier by using numbers in the spreadsheet.
Hello, I'm studying the trips of domestic cats. I'd like to provide the cats' owners with a map showing the daily trips of their cat.
Basically, I'd like all the trips of day 1 in a color, day 2 in another color... I have in my CSV file a column named "LineStringColor" which attributes a color to each day. But after using the Excel to Google Earth converter, Google Earth only displays the trips of day 1 and day 2 (in two different colors) whereas I have 7 to 12 days to display. Why is that ? Can the converter or Google Earth take into account only two colors ?
It should draw all the colors. I would be happy to look at your spreadsheet. Please send to bill.clark@earthpoint.us
CAN I DRAW DESIGNED LINE LIKE DOTED
Unfortunately Google Earth only supports solid lines. The line color and thickness can be selected, but no dotted lines.
Mr. Clark, thank you so much for this amazing resource.
I have a dataset that has an azimuth value for each datapoint to show the direction the item was facing at that particular point in time (0 degrees to 360 degrees). Is it possible to upload this dataset using icon 196, so that the arrow points to the azimuth direction?
If I'm not mistaken, an IconHeading value of "line -180" points the arrow in the direction of the next datapoint on the map? I would like each arrow to point to its azimuth direction.
Thank you!
Subtract (or add) 180 from the azimuth direction. For example, if the azimuth direction is in column C, then the formula in the IconHeading column row 2, would be =C2-180
Or, the actual value could be put into the IconHeading column. For example, if the azimuth direction is 140 degrees, then any of 320, -40, =140 - 180, or =140 + 180 could go in the IconHeading column.
Post a Comment